For the next two weeks we will be exploring the spatial humanities — a vibrant and increasingly popular area of digital humanities research. Humanities scholarship is currently undergoing a “spatial turn” akin to the quantitative, linguistic and cultural “turns” of previous decades, and many are arguing that the widespread adoption of Geographic Information Systems (GIS) technology and user-friendly neogeography tools are fundamentally reshaping the practice of history and other disciplines. Yet while these powerful computer tools are certainly new, the mode of thinking “spatially” is not unprecedented, and may in fact be seen as a move away from the universalizing tendencies of modern western scholarship towards more traditional understandings of the lived experience of place, emphasizing the importance of the local context.
In practice, much of this scholarship involves creating maps — an act that is not without controversy. Maps are conventional representations of space that come laden with the embedded cultural worldviews of their makers. Maps are also highly simplified documents that often paper over contested or fuzzy boundaries with firm lines; it is hard to express ambiguity with maps, but it is very easy to lie with them. The familiarity of widespread tools like Google Maps and Google Earth might fool us into thinking these are unproblematic representations of space, but it must be remembered that all maps contain embedded assumptions and cannot be taken at face value. Maps produced in the course of humanities scholarship are not just illustrations but arguments, and they must be read with the same level of critical analysis that you would apply to articles or monographs.
Examples
One area of historical research that saw an early adoption of GIS is economic land use. A good example is Michael McCormick’s book on the Origins of the European Economy, which layered many different types of evidence against each other in a GIS to argue for a much earlier origin to Europe’s medieval economy than had been accepted previously. McCormick has since made his database publicly available and continues to add to it with collaborators at Harvard, as the Digital Atlas of Roman and Medieval Civilization.
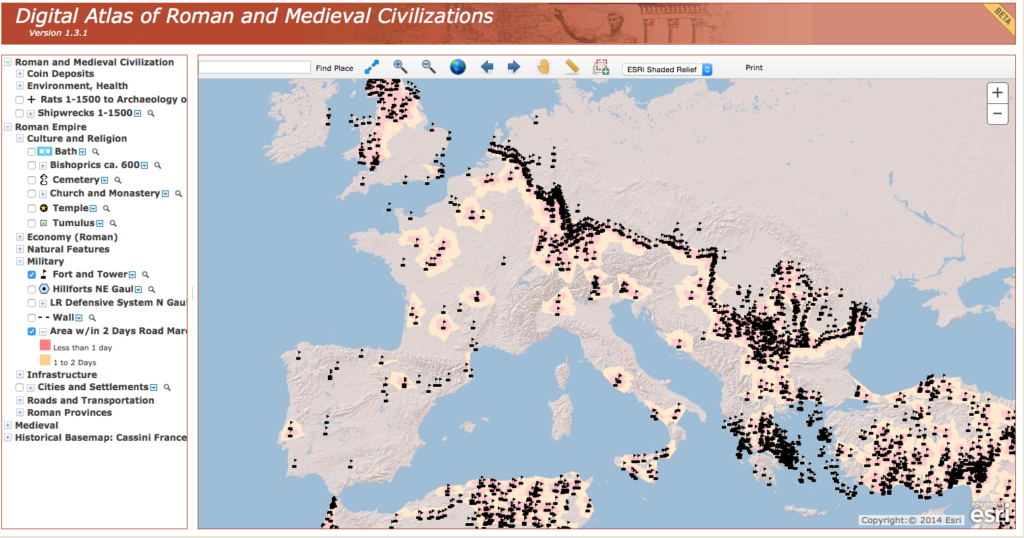
The DARMC provides a rich resource and a good introduction to the potential of GIS to reveal patterns and connections through the spatial layering of disparate datasets. It also offers a good orientation to the basic layout of most GIS systems, with a map view window on the right and a list of layers on the left that can be turned on and off.
- Explore the DARMC.
- What layers have been included?
- What patterns show up when you juxtapose cultural, environmental and economic data in this way?
- What connections do you see?
- Also take the opportunity to explore the measurement tools at the top of the window to interrogate the spatial attributes of the data.
The quantitative data compiled in projects like the DARMC can help address many historical problems, but they don’t necessarily answer more qualitative research questions concerned with the lived experience of the past. For this objective, we must move beyond birds-eye-view 2D maps of spatial distributions and attempt to visualize particular places at particular moments in time. Such “geovisualization,” the digital reconstruction of past landscapes, is another booming area of scholarship that allows us to virtually experience a place as it might have been, and also has the potential to answer important scholarly questions.
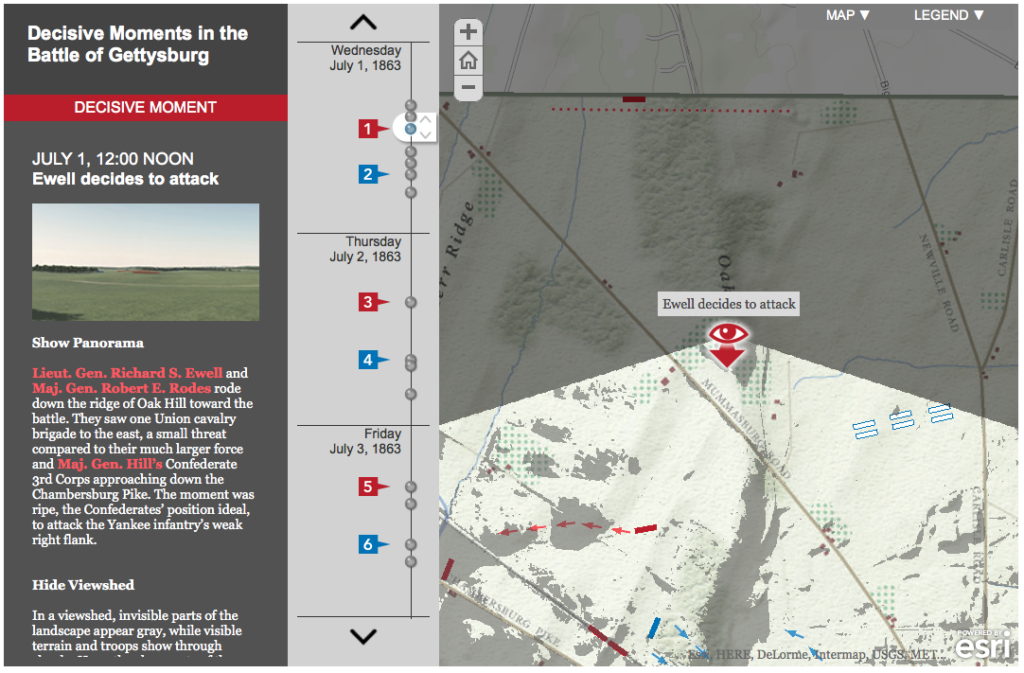 Anne Kelly Knowles’ digital reconstruction of the Battle of Gettysburg is an excellent example of this potential that uses a combination of digitized information from historical maps, documentary accounts and environmental data on the physical geography of the battlefield to answer the question of what the generals could see during the battle and how those sightlines influenced their decision making.
- Read the brief introductory article at Smithsonian magazine and then explore the “story map” in detail.
- How does the map combine geographic and temporal information?
- Does it effectively give you a sense of the experience of being on the battlefield?
- What does this reconstruction offer that more traditional publications could not?
- What could be improved in the representation?
Exercise (Georeferencing)
In order to reconstruct past landscapes like the Gettysburg battlefield, the first step is often digitizing the data recorded in a historic map by georeferencing (or georectifying) that image — that is, aligning the historical map or image with its location on the earth in a known coordinate system. There are many ways to do this, but we will start with a cloud based solution requiring no complex software.
The David Rumsey Map Collection is a vast archive of scanned historic maps, mostly covering North and South America. They have enabled a crowd sourcing technique to get the public to help georeference these images for use in GIS applications.
- Go to the David Rumsey Georeferencer page
- Watch the introductory video to get a sense of the process and then try your hand at it.
- You can choose a map at random or use the Search Luna button in the top right to find a specific one
- Use their tool to set control points (at least 5 are recommended), clip the map area, and rectify the map
- When you are finished, you will see the map overlaid on a baseman of the world.
- You can download your newly rectified map as a KML file by clicking the
 Open KML in Google Earth link at the top right
Exercise (Digitizing)
Now that you have coordinates for your image, you can bring it into a GIS program, align it with other spatially-aware data, and digitize the information by creating vector geometry from it. We’re going to do that in Google Earth as a first pass, since it is free, widely available and often people’s first introduction to using a GIS.
- Open your newly rectified map by clicking the Open KML in Google Earth link at the top right
- Or just use this map I rectified of Stillwater, MN
- Double-clicking the file should launch Google Earth and show you the map aligned over the modern satellite imagery.
- Before we go any further, let’s just explore that KML file. Does _ML look familiar? It should!
- Right-click the file in the Google Earth layer menu, copy it to the clipboard and then paste it in a text editor
- The result should look familiar. KML is the Keyhole Markup Language, yet another dialect of XML
- As with other flavors of XML, this as a data interchange format that allows for good interoperability — we can move our spatial data back and forth between different programs, and don’t have to be wedded to just one piece of software.
- There are many tools out there that will let you map and the golden rule is
- MAKE SURE YOU CAN GET YOUR DATA OUT BEFORE YOU WORK HARD PUTTING IT IN
- Before we go any further, let’s just explore that KML file. Does _ML look familiar? It should!
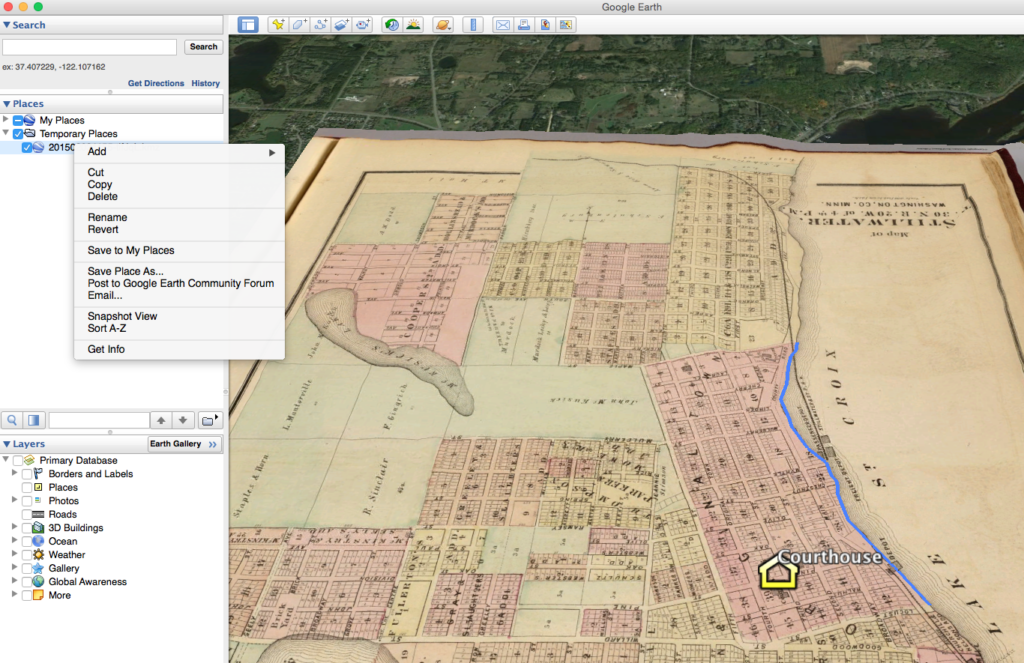
- Now use the Add Placemark, Add Polygon, and Add Path tools in the top menu to digitize features from your georeferenced map.
- For instance you could pinpoint the old courthouse (a placemark, or point), trace the old shoreline (a path, or line feature), or trace the outline of a neighborhood (a polygon).
- As you create features you can add metadata, change the symbols, and change the location of the camera to save alongside the feature in the Get Info window.
- Finally you can right click your newly created features and save them as KML or KMZ files (a zipped version of KML) for use in other programs.